
Spectroscopic examination is the only method that allows conservators and art historians to precisely identify the materials artists used for their works. This information enables art historians and scholars to understand what artistic materials were available during a certain period in a particular region, and therefore illuminates trade routes and interactions among cultures. Spectroscopy may also help uncover the manufacturing methods used to fabricate artistic materials, providing valuable data about the development of technical skills over time.
Spectroscopy also enables scholars to date objects. Because some materials were available in particular regions and periods, the retrieval of pigments with a well-known date of invention allows art historians to date artifacts post quem. Other pigments may be known to have disappeared from the artists’ palette, so their presence permits experts to date artifacts ante quem.
Spectroscopy is also extremely useful to fight forgery. Fake artworks can be spotted when anachronisms arise in the materials, and the materials don’t align with those used in known works by the same artist. But spectroscopy is most often used for conservation, because it pinpoints the causes for the deterioration of artwork, as well as how to counteract it.
Vibrational Spectroscopy
Atoms in a molecule are in periodic vibrational motion with each other. The frequency of these periodic vibrational motion is known as vibration frequency and it’s characteristic of each chemical compound. Therefore, if the vibrational frequencies of a molecule can be measured, it is possible to compare those to a database of frequencies and determine the name of the molecule. This is what vibrational spectroscopies do.
The most direct way to probe the vibrational frequencies of a molecule is through infrared spectroscopy. This is because vibrational transitions typically require an amount of energy that corresponds to the infrared region of the spectrum. Raman spectroscopy, which typically uses visible light, can also be used to directly measure vibration frequencies.
Raman spectroscopy
Raman spectroscopy is non-invasive, non-destructive, and fast. Fiber optics can even be used for remote investigation. Raman spectroscopists use the Raman spectra database of art and archaeological materials to determine the chemical composition of a sample. Raman spectrometers are typically coupled with a microscope in order to observe the sample and can take a Raman spectrum from a small area down to 1micron, which is the usual dimension of artists’ pigments.
Identify tiny particles of pigments
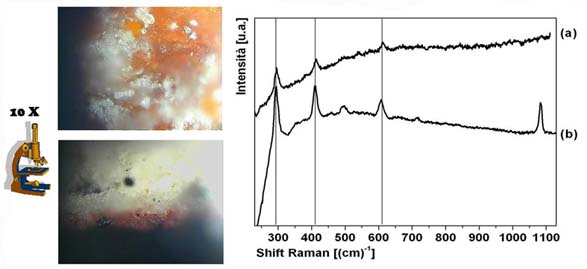
Raman spectroscopy can easily identify the red pigment used for a fresco by matching a sample from the original artwork with the corresponding pigment in the database.
Place a tiny red fresco fragment under a Raman microscope, move the slide until you center a red particle, and shine the tiny laser on it in order to get the Raman spectrum (a). Then, compare that with spectra in your database of pigments and you will find that red ochre (b) exactly matches the three peaks. The fourth peak on the right is that of calcium carbonate, the fresco support.
Solve a common conservation problem.
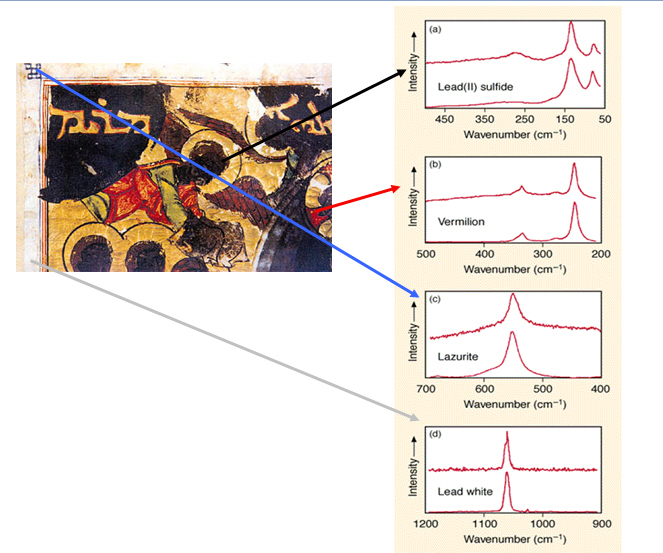
Figure out the mystery of why this angel from a Byzantine illuminated manuscript appears to be black.
Byzantine illuminated manuscript, series of readings based on the gospel, 1220, British Library.
In the 13th century, Byzantine manuscript illustrators weren’t likely to paint black angels. So why is this angel clearly black?
The Raman spectra from the blue details on the left corner shows that it is ultramarine. That would make sense, since Byzantine illustrators often used ultramarine. It shows that the red color of the gown is vermillion, which also fits, as does the lead white frame. Examine the face of the angel, though, and the Raman spectra matches it with lead sulfide. That was never known to be a pigment, so what’s the story?
It turns out that lead white is blackened on contact from sulfides in the air. The sulfides cause the chemical reaction of lead carbonate to black lead sulfide. Hydrogen sulfide was abundant at the British Library—where the manuscript is conserved—due to the gas lamps used at the museum during the Victorian age. Therefore, the lead white mixed with red pigment for the illustration’s flesh tone has turned to black lead sulfide.
How it works
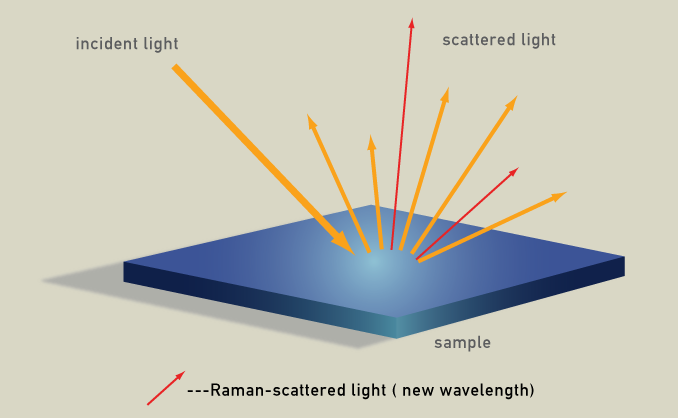
The Raman effect was discovered in 1928 by Sir C.V. Raman. Radiation scattered by molecules contains photons with the same frequency as the incident radiation, but may also contain photons with changed or shifted frequency. This effect is very weak—approximately one photon out of a million (0.0001%) will scatter from that sample at a wavelength slightly shifted from the original wavelengths.
By the end of the 1930s, Raman spectroscopy had become the principle method of non-destructive chemical analysis. Infrared spectroscopy became the preferred method after World War II, primarily because it became much easier to use due to the development of sensitive infrared detectors and advances in electronics. Infrared spectroscopy measurements became routine, while Raman spectroscopy still required skilled operators and darkroom facilities, and needed to be constantly maintained and calibrated. During the 1990s, the development of CCD as spectroscopy detectors and lasers led to cheaper and easy-to-use Raman spectrometers. Today, Raman spectroscopy is a fast-growing technique, not only because of the analytical information it provides, but also because it is non-invasive, non-destructive, and fast — and therefore very useful for art examination.
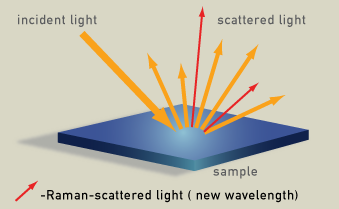
Radiation scattered by molecules contains photons with the same frequency as the incident monochromatic radiation (laser) (orange in the diagram), but also contains photons with shifted frequency (red in the diagram), the Raman radiation. The spectrum of this wavelength-shifted light is called the Raman spectrum.
|
Choose: |
|
Raman fingerprints Look at the Raman spectra of three blue pigments: ultramarine, azurite, and cobalt blue. Raman spectra consist of sharp peaks whose position and height are characteristic of each specific molecule. See how each differs from the other? Because of these differences, Raman spectroscopists compare their sample to Raman spectra databases of materials to discover the sample’s chemical composition. |
|
Raman spectra consist of sharp bands whose position and height are characteristic of the specific molecule in the sample. Each line of the spectrum corresponds to a specific vibrational mode of the chemical bonds in the molecule. Since each type of molecule has its own Raman spectrum, this can be used to characterize molecular structure and identify chemical compounds.
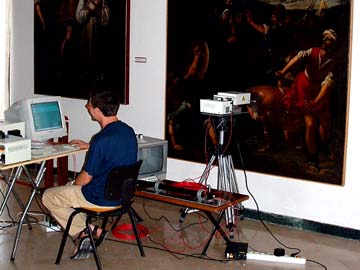
Raman spectroscopy in a museum. This method is non-destructive and non-invasive, and is therefore utterly safe method for examining objects.
Technical details
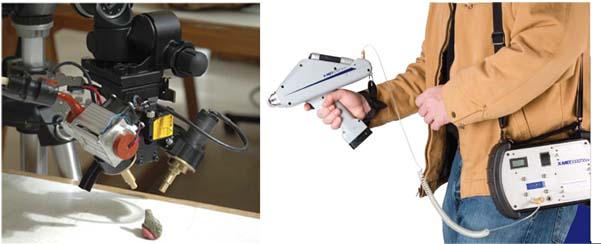
Since the first experiment in 1928 by Sir C.V. Raman, Raman spectrometers have evolved into compact and easy-to-operate bench top, mobile, and hand-held versions.
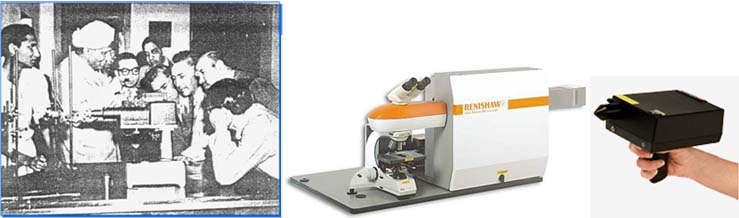
Left: Sir C.V. Raman with his students. Middle: a bench top Raman spectrometer. Right: a mobile and hand-held Raman system.
Fourier transform infrared (FTIR) spectroscopy
FTIR analysis characterizes materials, and is especially useful in recognizing inorganic mixtures. With FTIR, Raman and XRF are used together, making it possible to detect the majority of pigments, describe complex mixtures, and reconstruct simple sequences of pigment layers. FTIR, as Raman spectroscopy, can provide the molecular and structural information about organic and inorganic materials. Both techniques allow non-destructive and in situ analysis, which is always desirable.
The development of microscopies and microprobes has created new opportunities for non-destructive in situ analyses of samples, such as frescoes in church domes. FTIR and Raman spectroscopies, microscopies, and microprobes have also been used successfully in the studies of sculptures and wall decorations, archaeological sites, pottery, polychromed works, and oil on canvas.
FTIR and Raman spectroscopies are considered complementary techniques. Just a few pigments can be analyzed only by Raman and not by FTIR, such as sulfide pigments (for instance, cadmium yellow, vermilion) and carbon black pigments of vegetable origin. However, compared with FTIR, Raman is much less sensitive to organic materials, such as varnishes, binders, and some organic pigments.
Discover how illustrators shrewdly decided when and where to use expensive pigments.
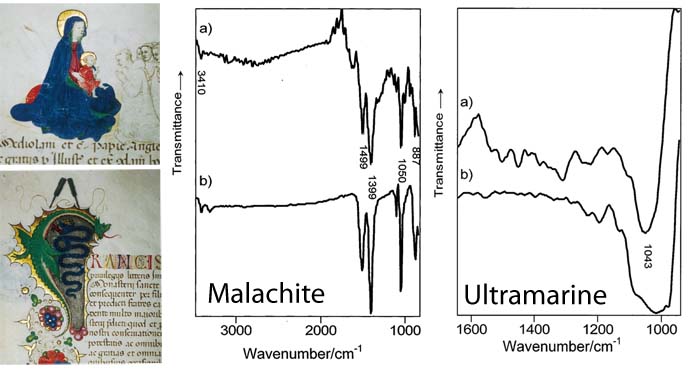
Even though all of the blues in this manuscript may look "blue" to the human eye, certain blue pigments are more expensive than other blue pigments. FTIR spectroscopy (graphs, above middle and above right) can give us insight into an artist’s methodology by revealing the exact pigment that an artist used for each portion of the painting.
Manuscript, "Concessione di Francesco Sforza alla Certosa di Pavia", 1450, State Archives of Milan. Left: Illuminated figures analyzed by FTIR. Middle: IR spectrum of the green dragon. Right: IR spectrum of the Virgin’s blue cloak.
The manuscript above, created in 1450, is confirmation to the Pavia’s Certosa of the donations, privileges and freedom from duties that had been granted to the Institution by Giangaleazzo Visconti.
How did illustrators judiciously use expensive pigments on this 15th century parchment document? FTIR spectroscopy holds the answers.
In the middle graph, observe how the FTIR spectrum of the green dragon (a) overlaps with that of malachite (b). Further analysis throughout the manuscript shows that malachite was applied to all the green areas.
The graph on the right shows how the spectra of the blue area on the Virgin’s cloak (a) is comparable with that of ultramarine (b). In contrast, the spectrum of the blue in the initial capital letter in the text is that of the less costly azurite. Following a traditional medieval practice, blues were used in a hierarchy according to the importance of the object being illustrated. In this manuscript, brushstrokes of the extremely valuable ultramarine were reserved for the Virgin’s cloak.
How it works

Atoms in a molecule are in periodic vibrational motion with each other.
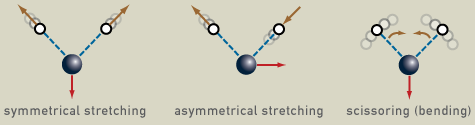
The frequency of this periodic vibrational motion is known as vibration frequency and it’s characteristic of each chemical compound. For instance, water, which is a nonlinear molecule, has three fundamental vibrations.
When a quanta of infrared light (an infrared photon) interacts with the molecule, it may absorb the energy and vibrate faster.
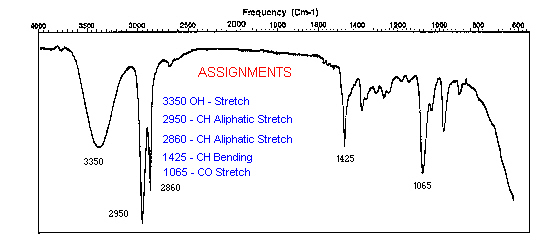
If there is a beam of light that contains all the wavelength components in the IR range, when it passes through a sample one or more of its components will be absorbed and we will see those missing wavelengths in its spectrum. Using a database of IR correlations, each missing peak could be linked to a specific vibration as the stretching between oxygen and hydrogen (OH-stretch). Below is an example of an IR spectrum with peaks assigned to their vibrations in the molecule.
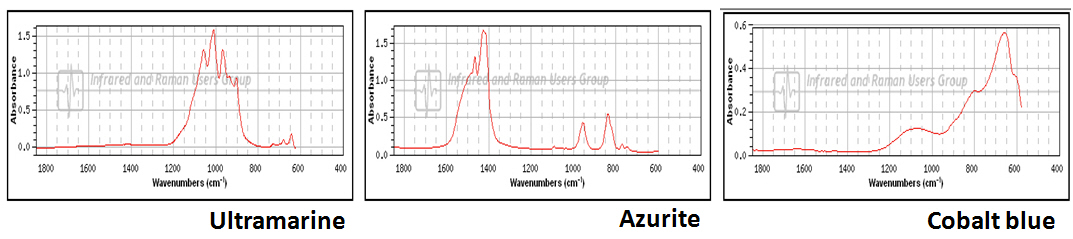
As with Raman spectroscopy, FTIR spectra consist of bands whose positions and heights are characteristic of the specific molecule in the sample. Each line of the spectrum corresponds to a specific vibrational mode of the chemical bonds in the molecule. Each type of molecule has its own FTIR spectrum. For example, three blue pigments - ultramarine, azurite, and cobalt blue, each have very different FTIR spectra.
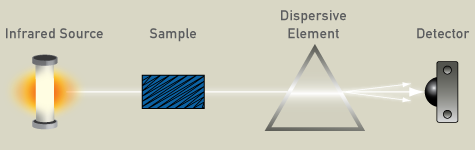
Infrared is an absorption technique, as it passes through the sample, and is then detected. A dispersive spectrometer is composed of an IR source, usually a glowing ceramic element, a compartment for the sample, a dispersive element (a grating), and a semiconductor detector for the analysis of the spectrum.
Technical details
Fiber optic mid-FTIR is a non-destructive and non-contact spectroscopic method. The fiber optic probe is kept strictly perpendicular to the sample’s surface by a mechanical arm. The distance between the probe tip and the surface can be fixed at about 5 mm, avoiding contact between the fibers and the artwork.
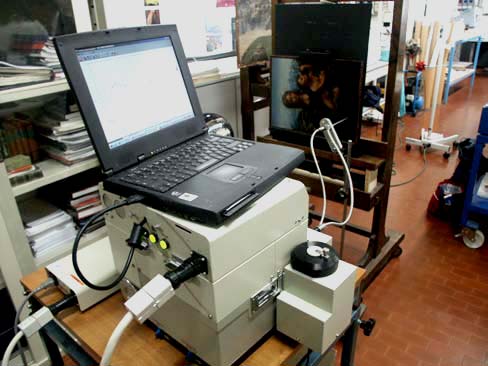
Fiber optics FTIR allows non-invasive and non-destructive examination of art materials. A fiber optics probe is put close to the painting and it is use to collect the FTIR spectrum.
Elemental Spectroscopy
Vibrational spectroscopy is one type of spectroscopy; elemental spectroscopy is the other major type. The key method for examining art is XRF, or x-ray fluorescence spectroscopy. XRF has become a powerful and portable analytical tool. The technology works by irradiating samples of materials without destroying the analyzed material. At the same time, it can identify a vast number of elements simultaneously, making it an excellent way to "fingerprint" all kinds of materials.
Conduct an elemental examination of a manuscript to determine the pigments that were used.
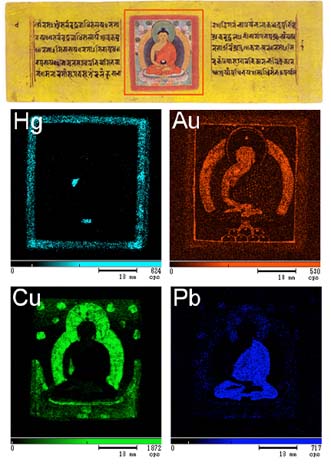
XRF reveals the various elements that are found in the pigments used to create this Nepalese manuscript. The top image shows the original Buddha illustration. The bottom 4 XRF images reveal the pigments used in different parts of the artwork.
Nepalese manuscript, Classical Manuscripts Digital Archive Study Center, Ryokoku University Library, Japan.
We can use XRF to map the chemical elements, and consequently the pigments, in an ancient Nepalese manuscript containing a colored illustration of Amida, a celestial Buddha (top image, with the red box highlighting the analysis region).
The bottom 4 images illustrate XRF elemental mapping for Hg, Au, Cu and Pb.
The elemental mapping for mercury (Hg) begins the process, and will appear on the red frame. Mercury is the main component of vermilion, which is the pigment used there. Next is the search for gold (Au). We see it on the Buddha’s skin and on the halo, revealing that they are made from gold leaf. Finally, the map of copper (Cu) shows azurite in the blue halo and malachite on the green leaves. The lead (Pb) map shows red lead in the Buddha’s gown.
Fake pottery
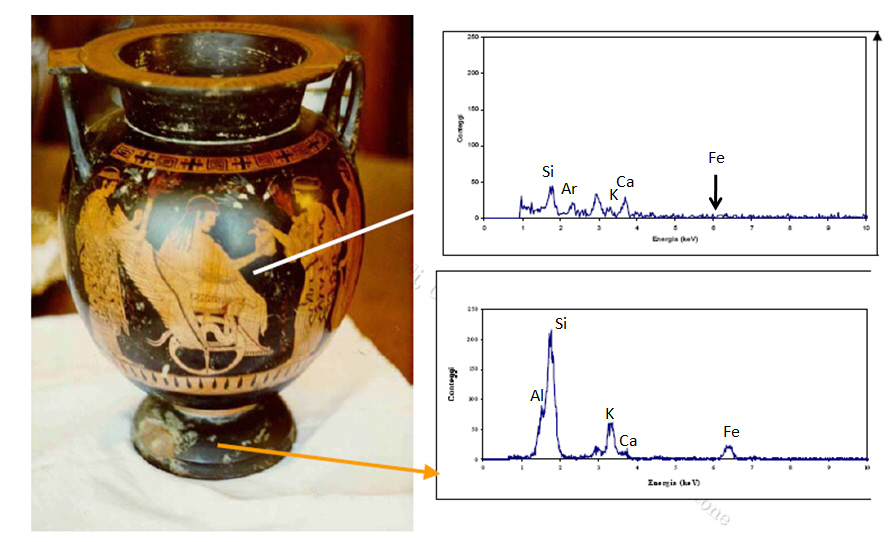
Compare and contrast the blacks used in two different parts of this Greek vase to determine whether it is an authentic Greek vase or a fake one. The top right graph is an XRF of the vase’s black paint. Note the difference between this graph and the one below it, which is an SRF of the original black paint. What do the differences in the XRF graphs tell you about this Greek vase?
Is the vase a fake?
An art historian might take a sample and run thermoluminescence dating on this vase, but it is a lengthy and costly process. You might be able to get an answer more quickly with XRF. After all, forgers cannot replicate the original Greek technique for black paint.
Look at the XRF spectra of an original black paint and forged black paint. The key element is iron (Fe). The Greeks artists used a mix of clay rich in iron oxides for black paints; the forger didn’t.
How it works
X-ray fluorescence (XRF) is an analytical technique that uses the interaction of x-rays with a material to determine its elemental composition. X-rays form part of the electromagnetic spectrum, and are characterized by energies lying between ultraviolet and gamma radiation. When x-rays interact with material at the atomic level, they can be absorbed and can cause subsequent fluorescence. This x-ray fluorescence forms the basis of XRF spectroscopy.
An incoming x-ray knocks out an electron from one of the orbitals surrounding the nucleus within an atom of the material. A hole is produced in the orbital, resulting in an unstable configuration for the atom. To restore equilibrium, an electron from a higher energy, outer orbital falls into the hole. Since this is a lower energy position, the excess energy is emitted in the form of a fluorescent x-ray. The energy difference between the expelled and replacement electrons is characteristic of the element atom in which the fluorescence process is occurring - thus, the energy of the emitted fluorescent x-ray is directly linked to a specific element being analyzed.

The process of x-ray fluorescence. An incoming x-ray knocks out an electron from one of the orbitals surrounding the nucleus. A hole is produced in the orbital, and an electron from a outer orbital falls into this hole, emitting energy in the form of an x-ray.
In general, the energy of the emitted x-ray for a particular element is independent of the chemistry of the material. For example, a calcium peak obtained from CaCO3, CaO, and CaCl2 will be in exactly the same spectral position for all three materials. The range of detectable elements varies according to instrument configuration and set up, but typically XRF covers all elements from sodium (Na) to uranium (U). Concentrations can range from 100% down to ppm (part per million), and in some cases sub-ppm levels. Limits of detection depend upon the specific element and the sample matrix, but as a general rule, heavier elements will have better detection limits. XRF is widely used as a fast characterization tool in many analytical labs across the world, for applications as diverse as metallurgy, forensics, polymers, electronics, archaeology, environmental analysis, geology and mining.
In XRF applications, analysts are provided printouts of peaks that disclose the composition of the material under examination. The horizontal axis reveals the object’s elements (x-ray energy) - be it copper, silver, or traces of zinc - and the height of the peaks provides the percentage of the material present.
An example of XRF spectrum. On the X-axis, the energies are characteristic of each chemical element, while the height of each peak depends on the concentration of the element.
Technical details
XRF spectrometers are composed of two main parts, an x-ray source and x-ray detectors. These parts are clearly visible in some devices engineered for high-precision measurements. XRF systems can also be compact, hand-held instruments.
Some high-precision XRF systems are large and cumbersome, as in the device on the left, while others (right) are very compact hand-held instruments.